CO2
Sustainability
27.09.2022
Share

Carbon footprint of our products

At Aller Aqua we are proud to be among the first aquafeed companies worldwide to be verified to label our products with CO2 equivalents.

Our labelling is based on the PEFCR guidelines created by the European Commission. The PEFCR guidelines are a ruleset describing how to calculate the environmental footprint of a specific product group. In our instance, we have used:

Displaying our CO2 equivalents is a way for us to be transparent, whilst the verification validates our methods and results. Consumers increasingly request transparency about the food they buy. In the aquaculture value chain, we should be ready to meet these requests.

This will enable our customers to calculate and display the carbon footprint of their products. Additionally, the CO2 equivalents on the label can help spark a much-needed debate about sustainability and the complexity of the subject matter.

The CO2 equivalents can be found on our data sheets and product labels, and on request, we are also able to deliver a CO2 report to our customers including a calculation of the transportation emission.

Q & A

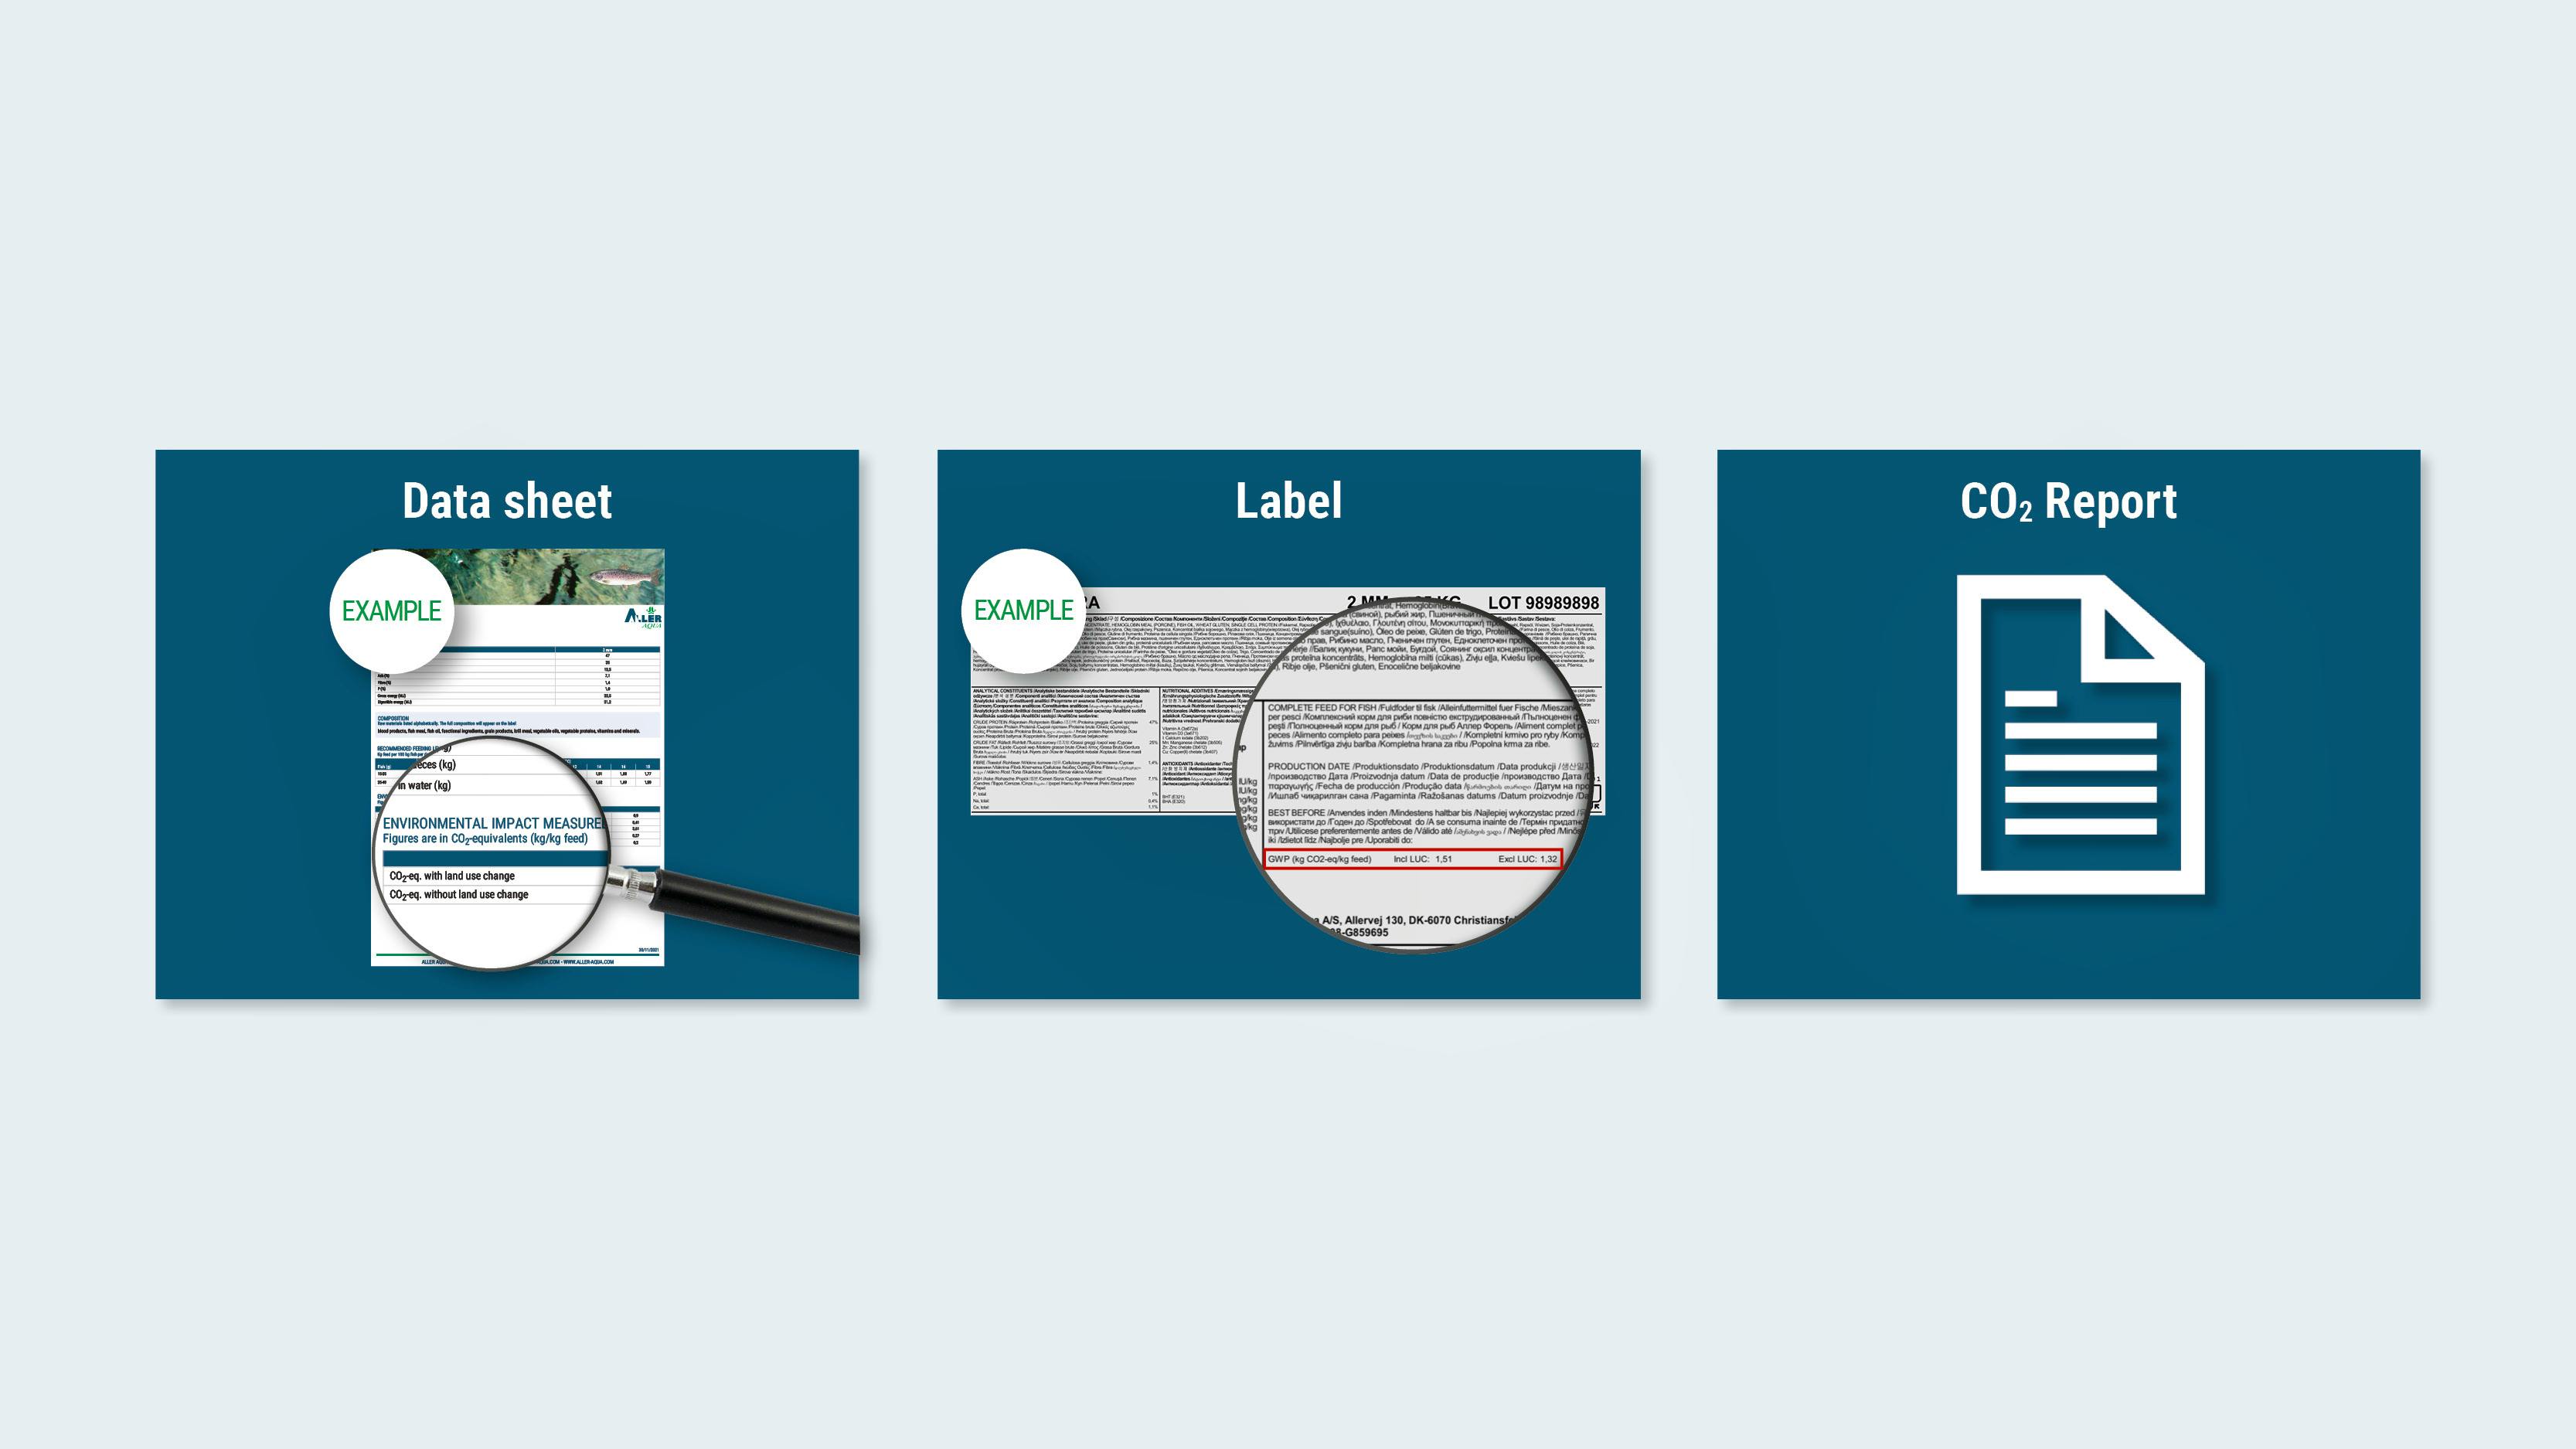
We have chosen to label our feeds with CO2 equivalents to create transparency about the impact of our products and to enable our customers to calculate the Carbon footprint of their products. In many places, this is not yet requested in the market, but we believe that it will be and then we are ready. To ensure that our numbers are valid and that we do things right, we have been verified by Bureau Veritas.

The Carbon footprint on the data sheets and labels quantifies the global warming potential of produced CO2 equivalents (CO2-eq) as kg per kg feed. The CO2 equivalent is the amount of CO2 that would create the same amount of global warming and provides a standardized value for the global warming potential of products. The CO2 equivalents of a specific process or product summarizes CO2 emissions, but also emissions of other greenhouse gases (shortened GHG) and other effects, like deforestation, of this process. The lower the CO2 equivalent value of a specific feed, the less this feed contributes to global warming. 

Two values of CO2 equivalents are stated on our labels and data sheets:  

With Land Use Change (LUC):  
The number includes the Carbon footprint derived by transforming the natural landscape into cultivation in the last 20 years, for example, deforestation to cultivate soy. 

Without Land Use Change (LUC):  
The number is exclusive to the Carbon footprint created by transforming the natural landscape into cultivation, for example already cultivated areas for wheat. 

On the labels, the exact Carbon footprint given as CO2 equivalents of the product will be shown. On the data sheets, a range will be presented to account for small adjustments in the production. 

All feeds from our factories in Denmark, Poland and Germany will display COequivalents on data sheets and labels, except organic feed. Feeds from other factories will follow at a later date. 

Organic raw materials are not yet considered in the environmental footprint databases.

The labelling for Carbon footprint does not reflect or affect feed quality or final fish quality. 

The recipes of the feeds have not been changed due to labelling for Carbon footprint.

There is no change in price connected to the labelling of feeds for Carbon footprint. 

There is no general difference in Carbon footprint between feeds for different species since a very different feed composition can lead to similar CO2 equivalents. In addition, each fish species can be offered a range of feeds, from intensive to extensive farming, EX or non-EX and floating or sinking feeds, possibly, but not necessarily, creating a range of CO2 equivalents for each species. 

The Carbon footprint is largely dependent on the raw materials in each feed. The final composition of a feed is however not the only determinator of the Carbon footprint of a fish farm. Therefore, more factors than purely the CO2 equivalents should be considered when choosing a sustainable feed for the farm.   

It is important to note that the feed conversion ratio (FCR) for each combination of feed and fish species will determine the Carbon footprint at fish farm level. A high-performance feed with a low FCR will show a lower Carbon footprint per kg fish produced than a medium-performance feed with a possibly similar Carbon footprint. Given the progression in FCR during fish growth and higher Carbon footprint in grow-out feeds due to possible higher inclusion rate of raw materials with higher Carbon footprint, small fish will show a lower Carbon footprint than larger fish of the same species per kg fish. 

Different raw materials contribute differently to the final Carbon footprint of a feed by showing deviating CO2 equivalents, both with and without Land Use Change. Some raw materials show a large spread in CO2 equivalents with or without Land Use Change, whereas in other raw materials these values are very close together. 

Several steps have reduced the Carbon footprint by: 

  • Changing the sourcing of raw materials from global to regional purchase, 

  • Changing the source of soy from South America to Europe* to reduce the Carbon footprint of soy with regard to transportation and cultivation (deforestation or Land Use Change), 

  • Using raw materials with little need of fertilizers (for example legumes/peas). 

*For our European factories. 

To enable our customers to calculate their CO2 equivalents, we have created a method to calculate the transportation emission. Customers can request a report from us, which contains the CO2 equivalents of the feed they have ordered, as well as a calculation of the CO2 equivalents of the transportation.